Algorithm-Visualizer
Learn Algorithms by seeing them in action! Algorithms made easy through animations made in python3 using tkinter library
Contents
- User Interface
- Features
- Algorithms Covered
- Cheat Sheet
- Things I learned while building this project
- Foreseeable future improvements
User Interface
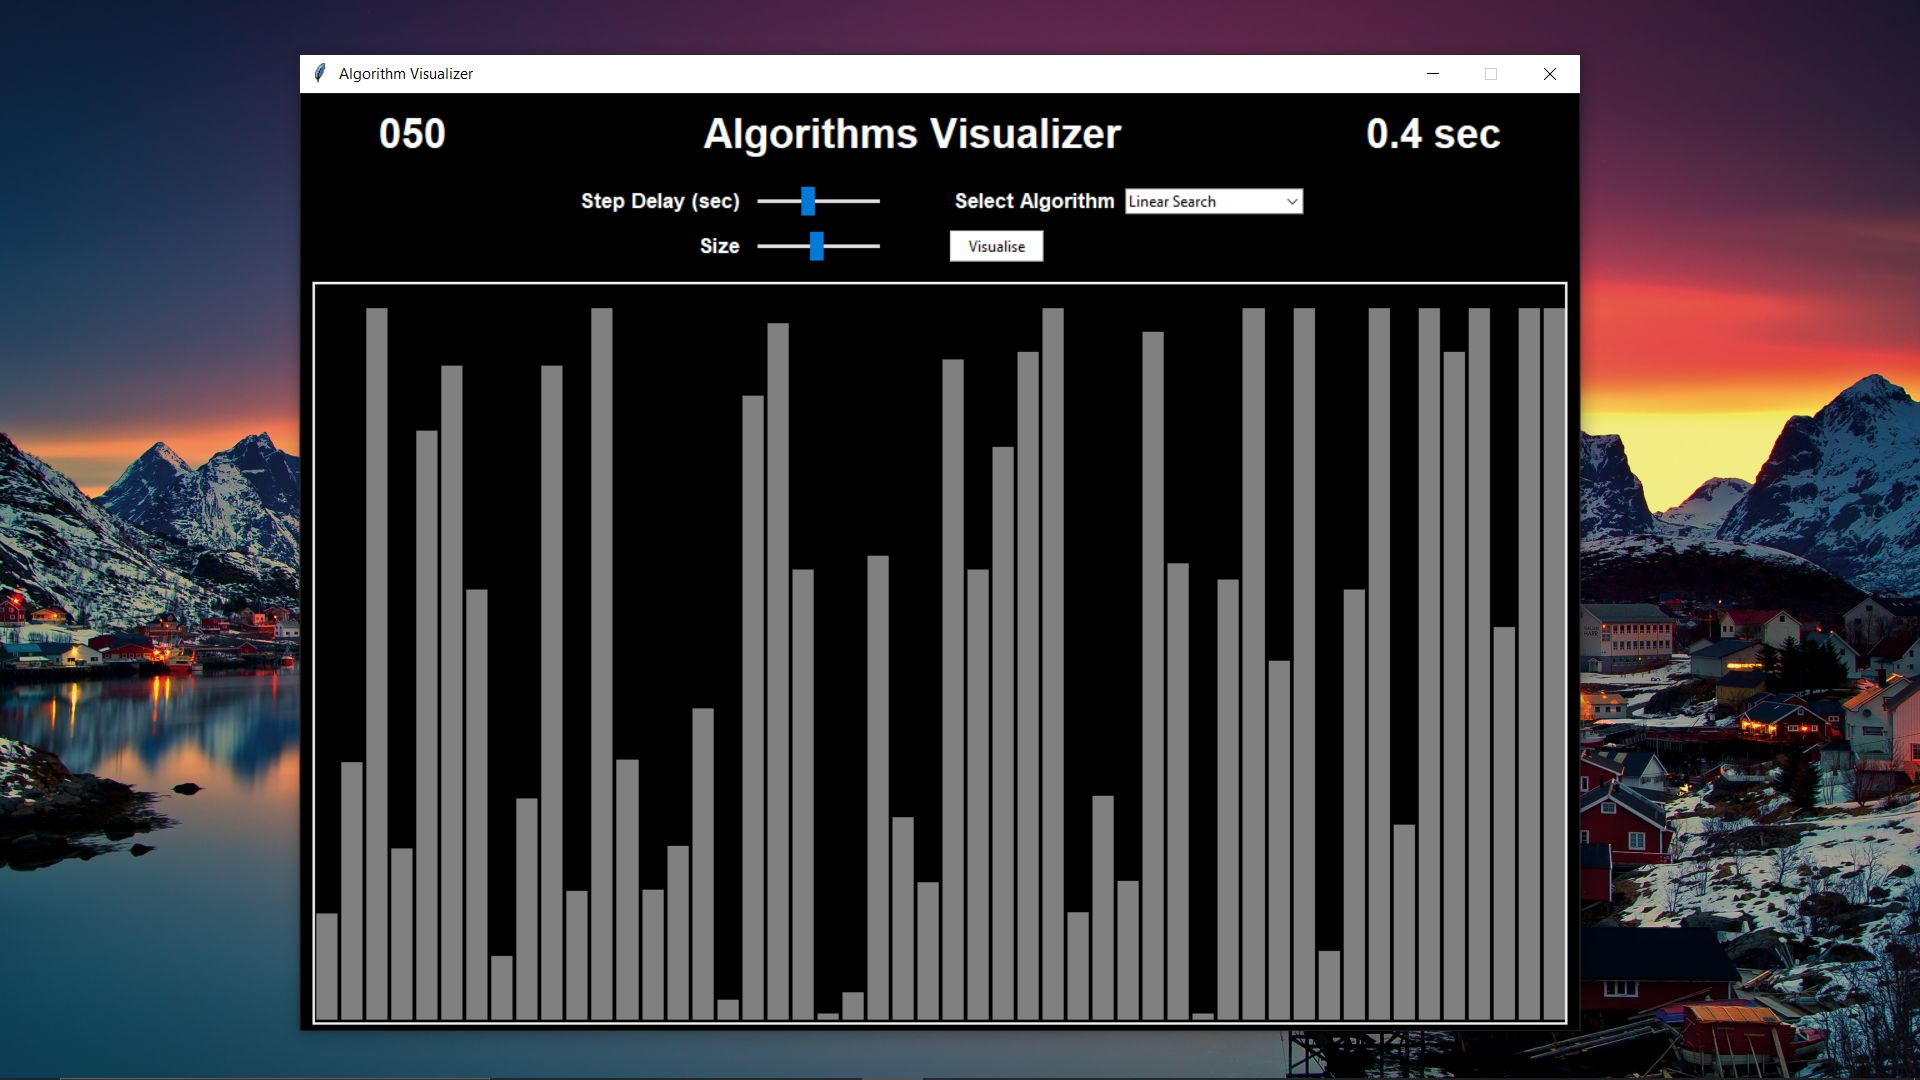
Features
- Generate rectangular components with random heights representing element values to be worked upon
- Change number of elements - ‘Size’ and dynamically update the rectangular components. ‘Size’ can range from 3 to 100
- Set ‘Step-Delay’ (in sec) - the time interval between each consecutive operation. Step-delay can range from 0.0-1.0 sec with a resolution of 0.1 sec
- Sliders have been provided for setting ‘Size’ and ‘Step-Delay’ thus eliminating the hassle of manual input
- Combobox for selecting Algorithm to visualize
- Counters for indicating ‘Size’ and ‘Step-Delay’
NOTE: Although efforts have been made to keep the color scheme of the elements intuitive enough, if you wish to check a particular color you can look up the color reference provided for every algorithm
Algorithms Covered
-
Searching
-
Linear Search

Complexity
- Best : Ω(1)
- Average : θ(n)
- Worst : O(n)
Color Reference
- Grey bar : Elements
- Blue bar : Element to be searched
- White bar : Element currently checking for equivalence
- Green bar : Element found
- Red bar : Element found unequal
Algorithm in action
-
</iframe>
-
Binary Search
Complexity
- Best : Ω(1)
- Average : θ(log n)
- Worst : O(log n)
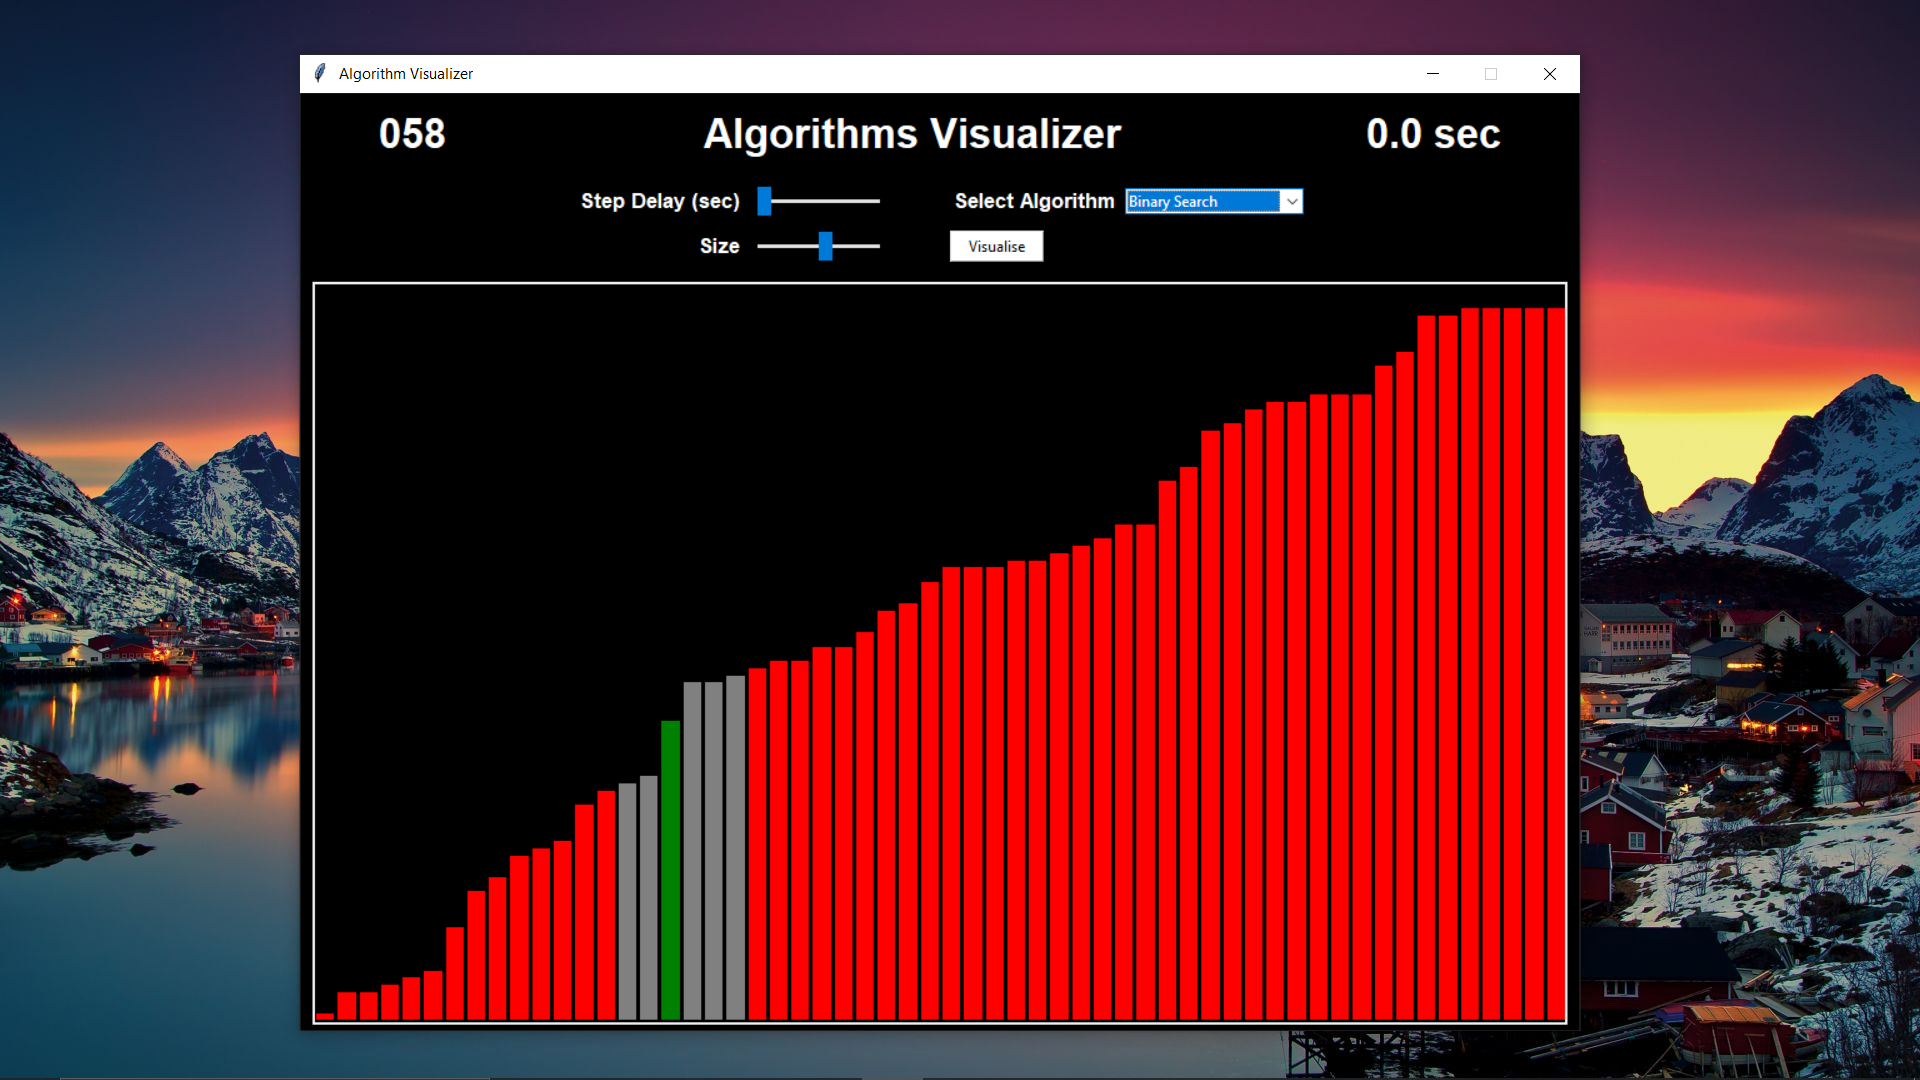
Color Reference
- Grey bar : Elements
- Blue bar : Element to be searched
- Red bar : Elements discarded after checking
- Green bar : Element found
Algorithm in action
</iframe>
-
Sorting
-
Bubble Sort

Complexity
- Best : Ω(n)
- Average : θ(n^2)
- Worst : O(n^2)
Color Reference
- Grey bar : Elements
- Red bar : Elements not found in sorted order
- White bar : Element currently being compared
- Green bar : Element in sorted order
Algorithm in action
-
</iframe>
-
Selection Sort

Complexity
- Best : Ω(n^2)
- Average : θ(n^2)
- Worst : O(n^2)
Color Reference
- Grey bar : Elements
- Blue bar : Element found to be minimum in that iteration
- White bar : Element being compared with minimum element
- Green bar : Element in sorted order
Algorithm in action
</iframe>
-
Insertion Sort
Complexity
- Best : Ω(n)
- Average : θ(n^2)
- Worst : O(n^2)
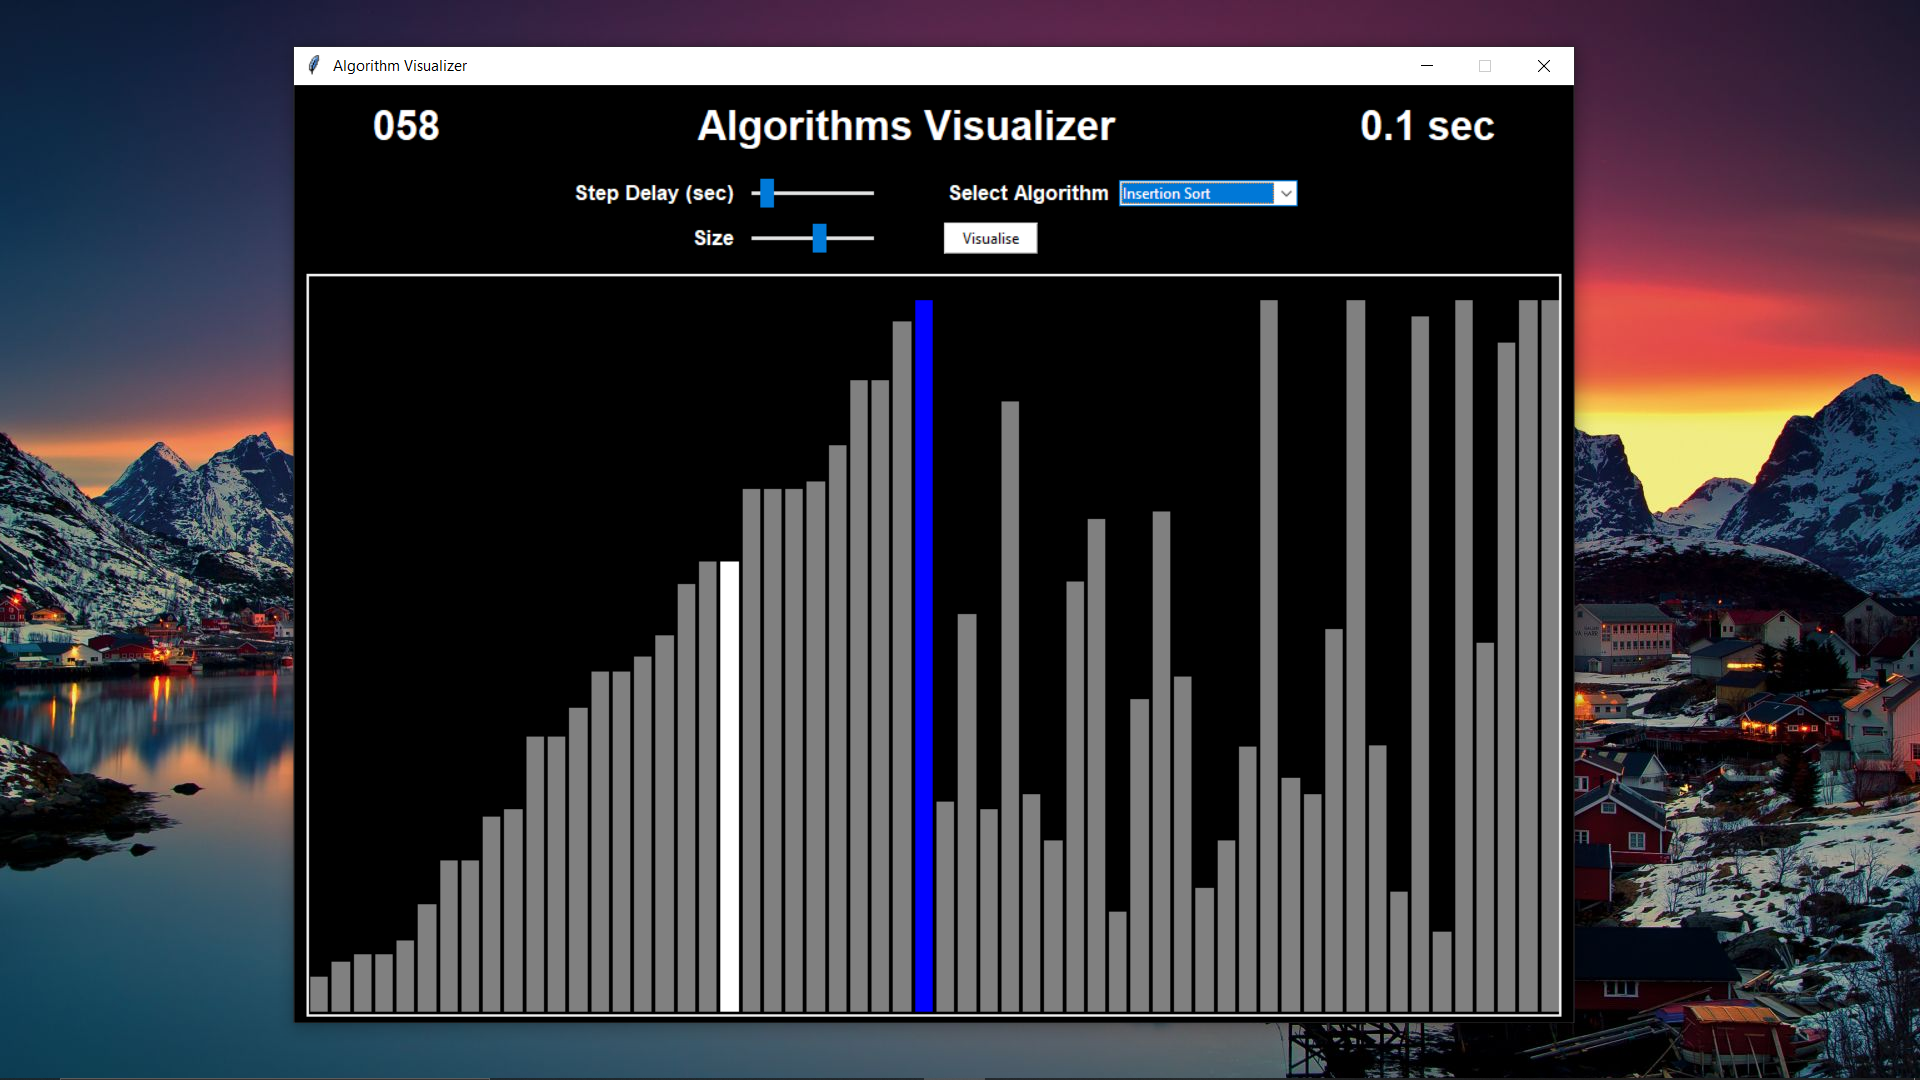
Color Reference
- Grey bar : Elements
- Blue bar : Element at key index (element to be inserted)
- White bar : Element
- Red bar : Element less than the element at key index
- Green bar : Element sorted
Algorithm in action
</iframe>
-
Merge Sort
Complexity
- Best : Ω(nlog n)
- Average : θ(nlog n)
- Worst : O(nlog n)
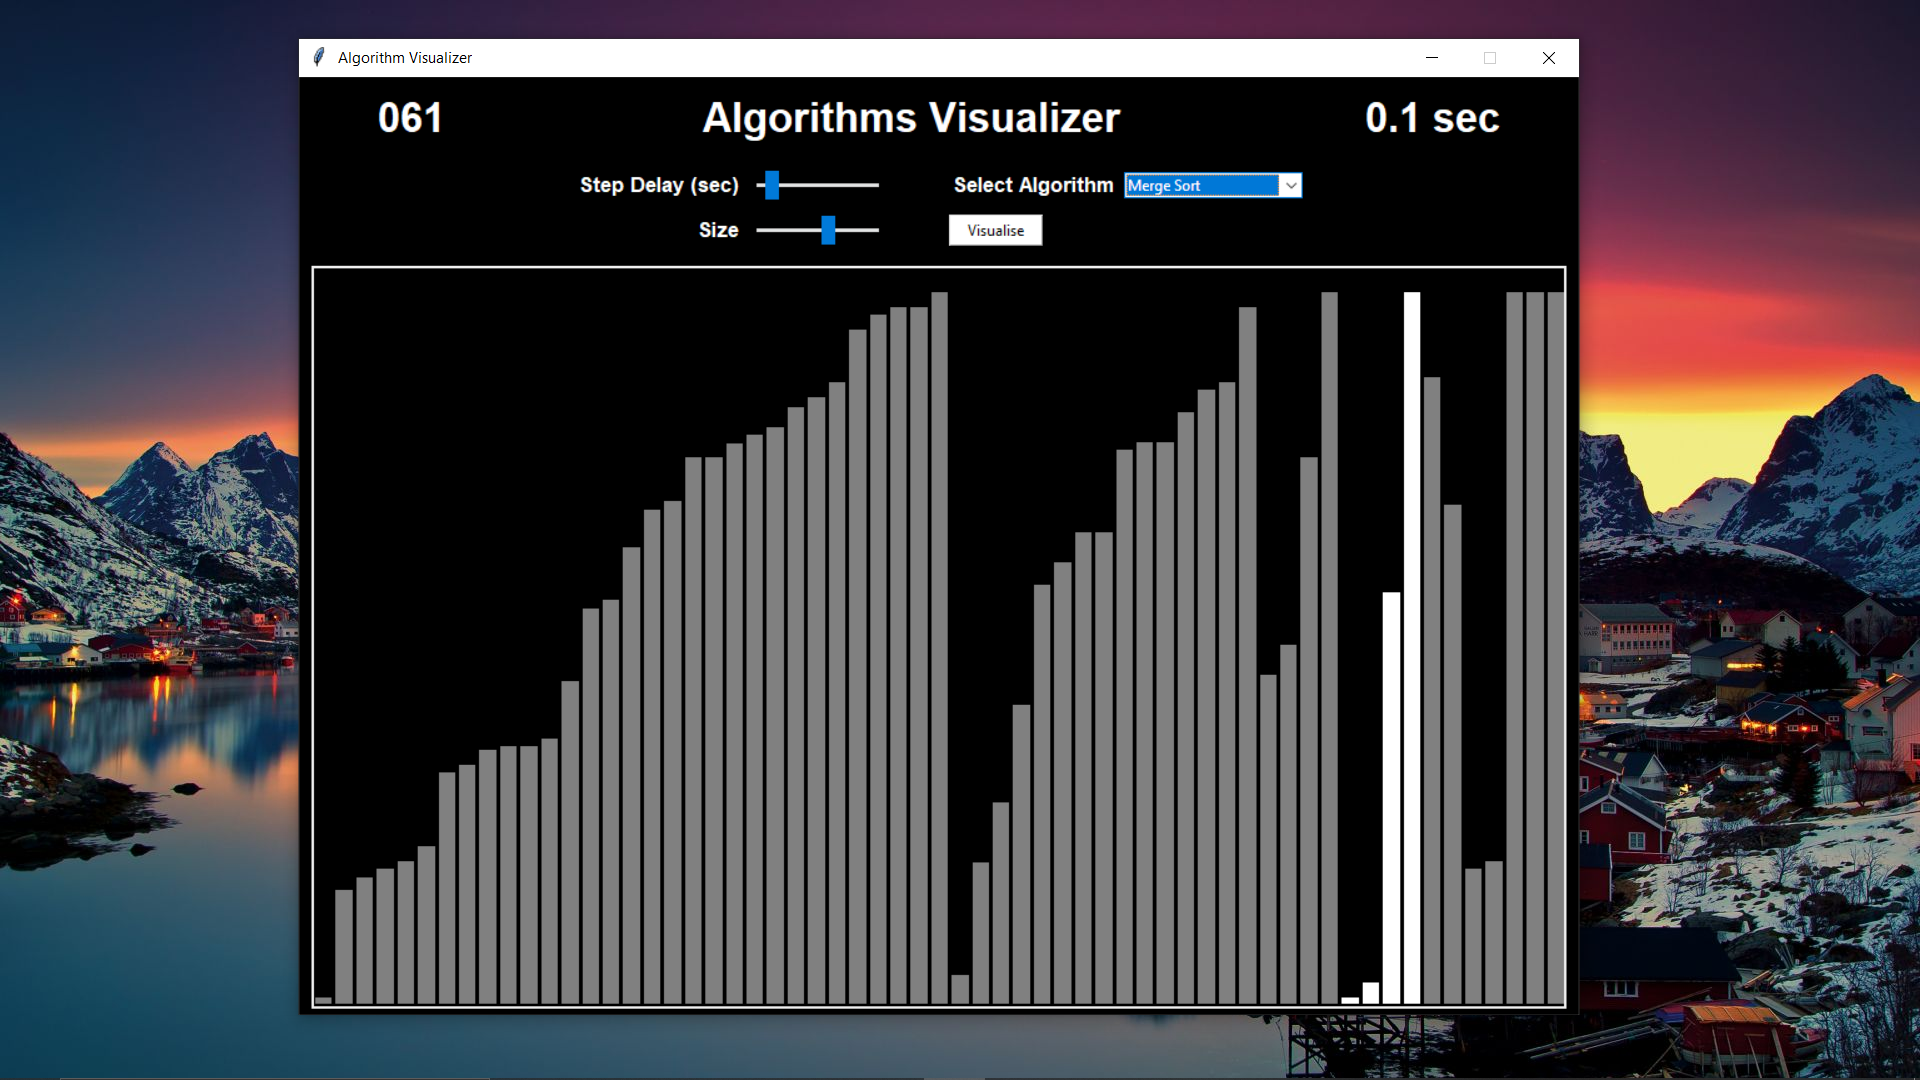
Color Reference
- Grey bar : Elements
- Blue bar : Elements being compared while merging sorted elements
- White bar : Elements being sorted recursively
- Green bar : Element found smaller while merging sorted elements
Algorithm in action
</iframe>
-
Quick Sort(*)

Complexity
- Best : Ω(nlog n)
- Average : θ(nlog n)
- Worst : O(n^2)
Color Reference
- Grey bar : Elements
- Blue bar : Elements being compared while merging sorted elements
- White bar : Elements being sorted recursively
- Green bar : Element found smaller while merging sorted elements
-
Radix Sort(*)

Complexity
- Best : Ω(nk)
- Average : θ(nk)
- Worst : O(nk)
Color Reference
- Grey bar : Elements
- Blue bar : Elements being compared while merging sorted elements
- White bar : Elements being sorted recursively
- Green bar : Element found smaller while merging sorted elements
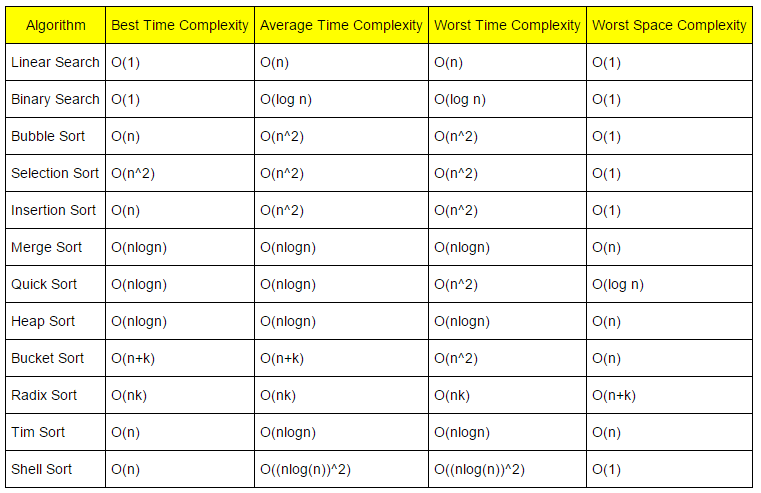
## Time complexity cheat-sheet
## Things I learned while building this project
- Increased my knowledge of algorithms
- Learned canvas object and its drawing functions in Tkinter
- Better UI design of desktop apps in Tkinter
- Embedding YouTube videos in Jekyll styled pages
## Foreseeable future improvements
- Adding more sorting algorithms
- Adding linked list and tree visualization capability
- Comparison feature between two algorithms side by side
- Selective control over elements like ‘ascending’,’descending’,’random’,’almost sorted’ to have better comparison in different circumstances
- Implement multi-threading to run tasks concurrently
- The whole visualization process implemented throught the matplotlib library
## Skip to a particular section